Website as Graphs
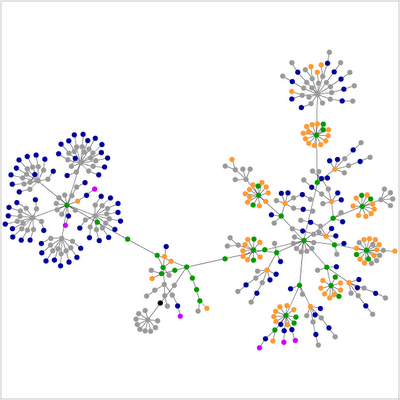
 OK, I don't know if this is just fun for geeks....but it's certainly pretty. Someone created this fun little applet that reads a website's source code and translates that codes into these little colored graphs. For example, red dots are tables, violet dots are images, yellow dots are forms, etc. The above graph is this site you're looking at now.
It's kind of fun putting in all kinds of sites and watching these little graphs "bloom" out. OK, it's entertaining for about 30 seconds. Remember watching those little sponge capsule animals that expand out when you drop them in water? Yeah...it's about as fun as that.
Check it out: http://www.aharef.info/2006/05/websites_as_graphs.htm


0 Comments:
Post a Comment
<< Home